
Sailing race analysis for a better debrief.
SailSync helps sailors and coaches review where places were gained or lost, compare performance with the fleet, and choose what to practice next. Custom reports, GPS tracks and 3D replays bring the same race into focus in different ways.
Explore the numbers behind your racing
Choose a leg, compare yourself with your peers, then review an individual maneuver. These iOS app examples show how you can explore performance directly as part of your debrief.
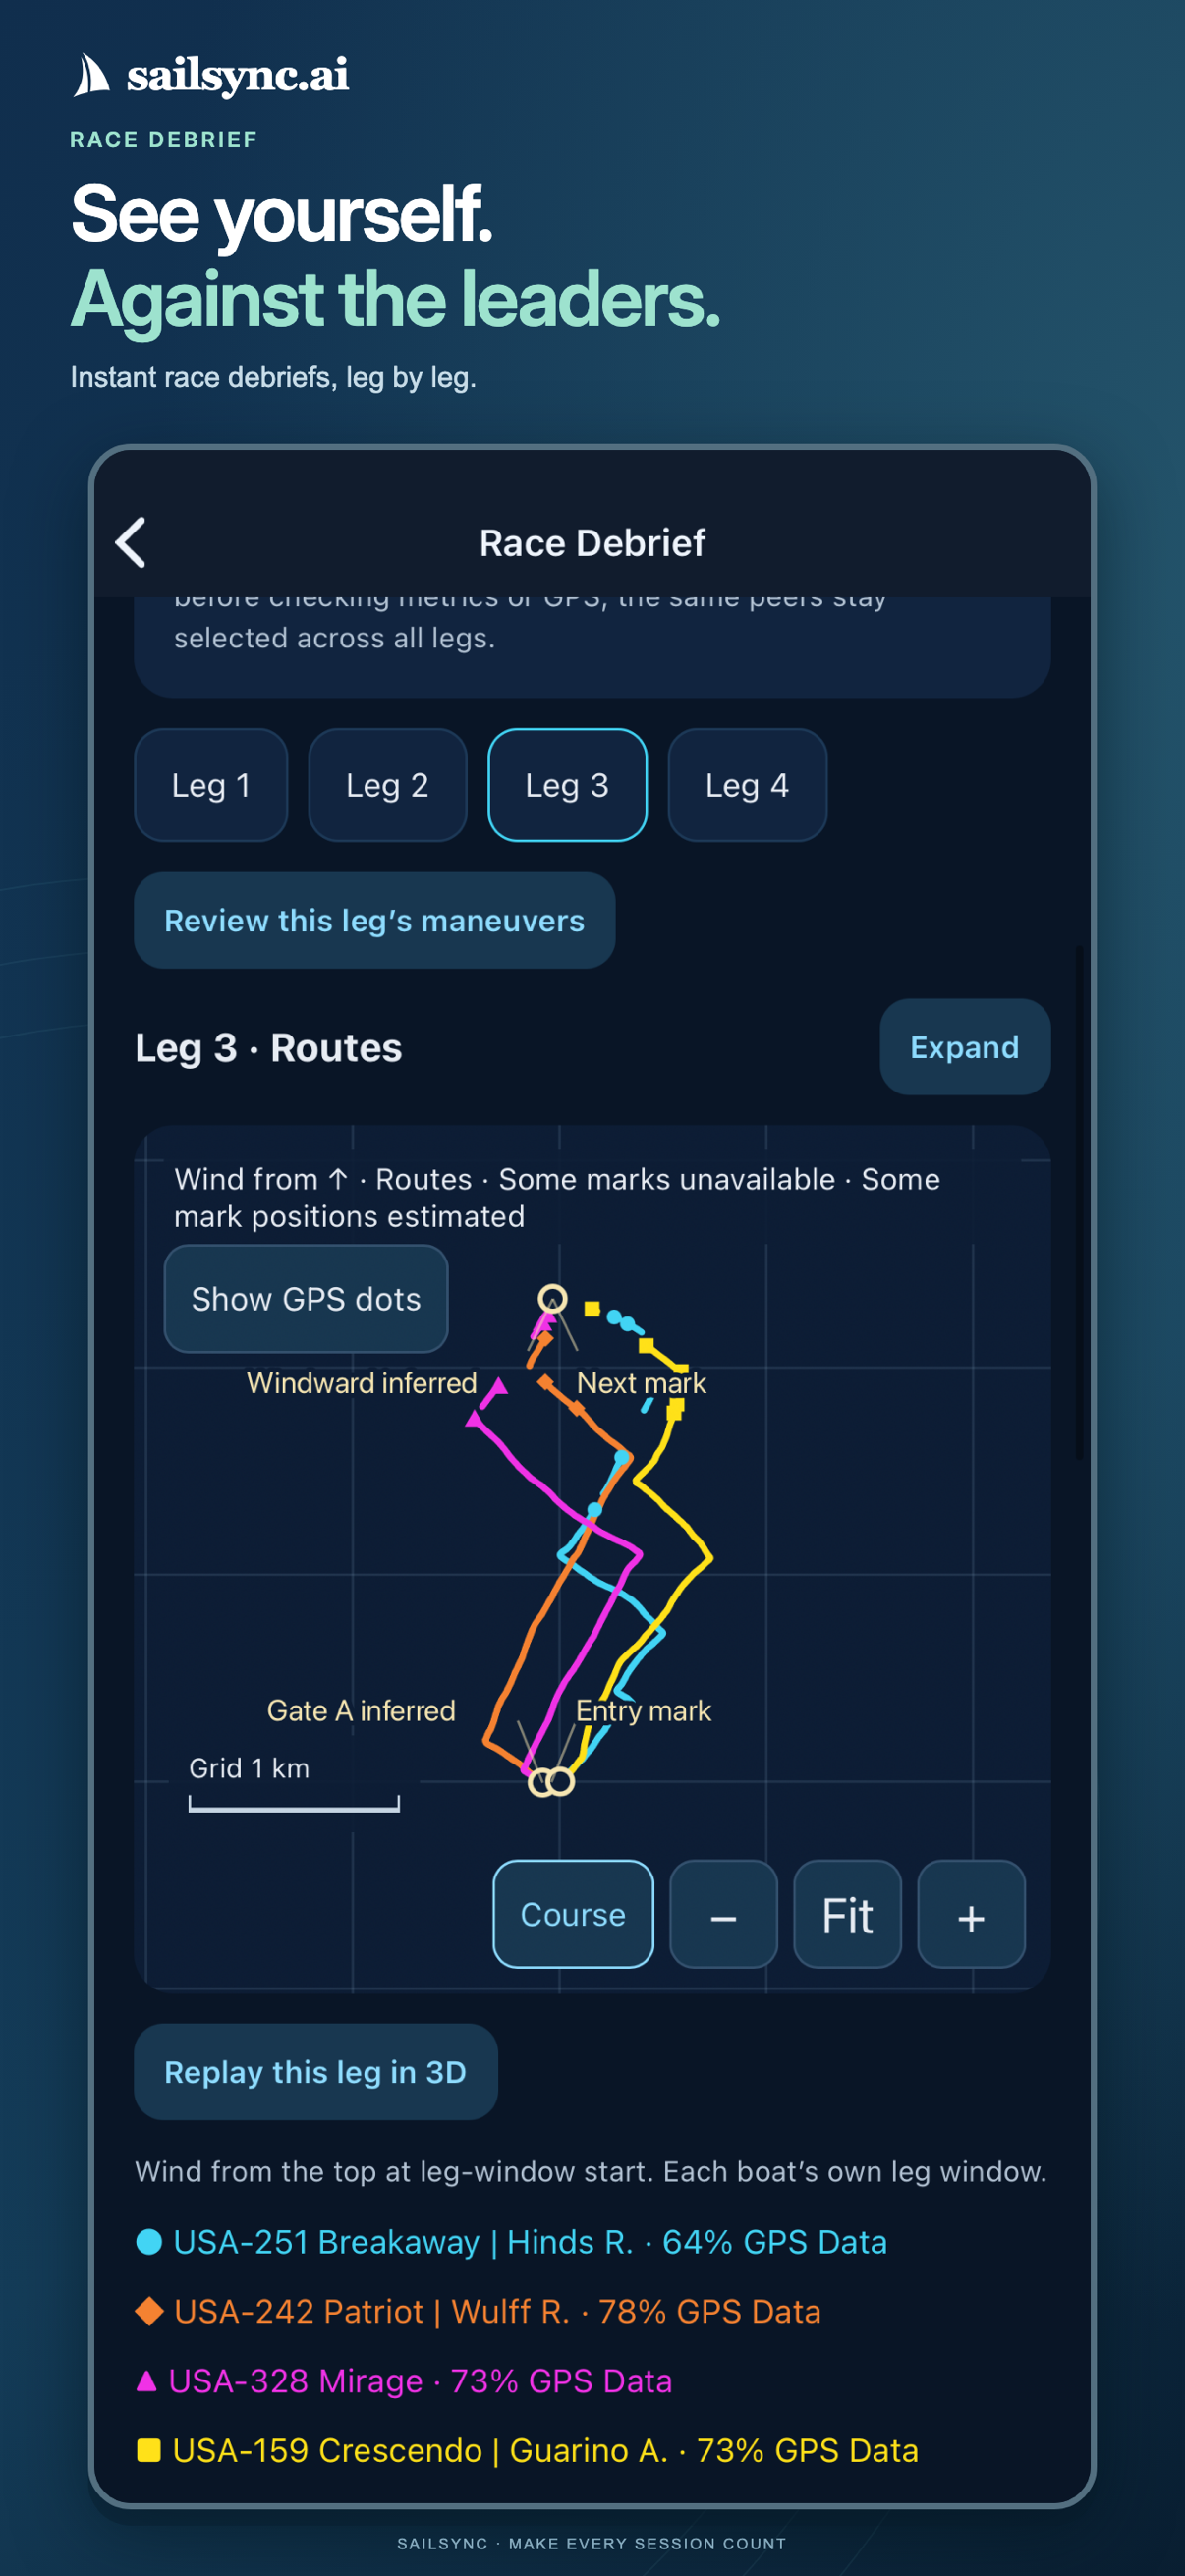
See the routes behind the comparison
Select a leg and compare the boats’ routes on the same course view. Follow where tracks separate, review the available mark context and open that leg in 3D.
Read this map alongside the leg metrics to connect the visual picture with speed, VMG and distance sailed. GPS coverage and inferred-mark labels keep the available evidence visible.
View full-size route map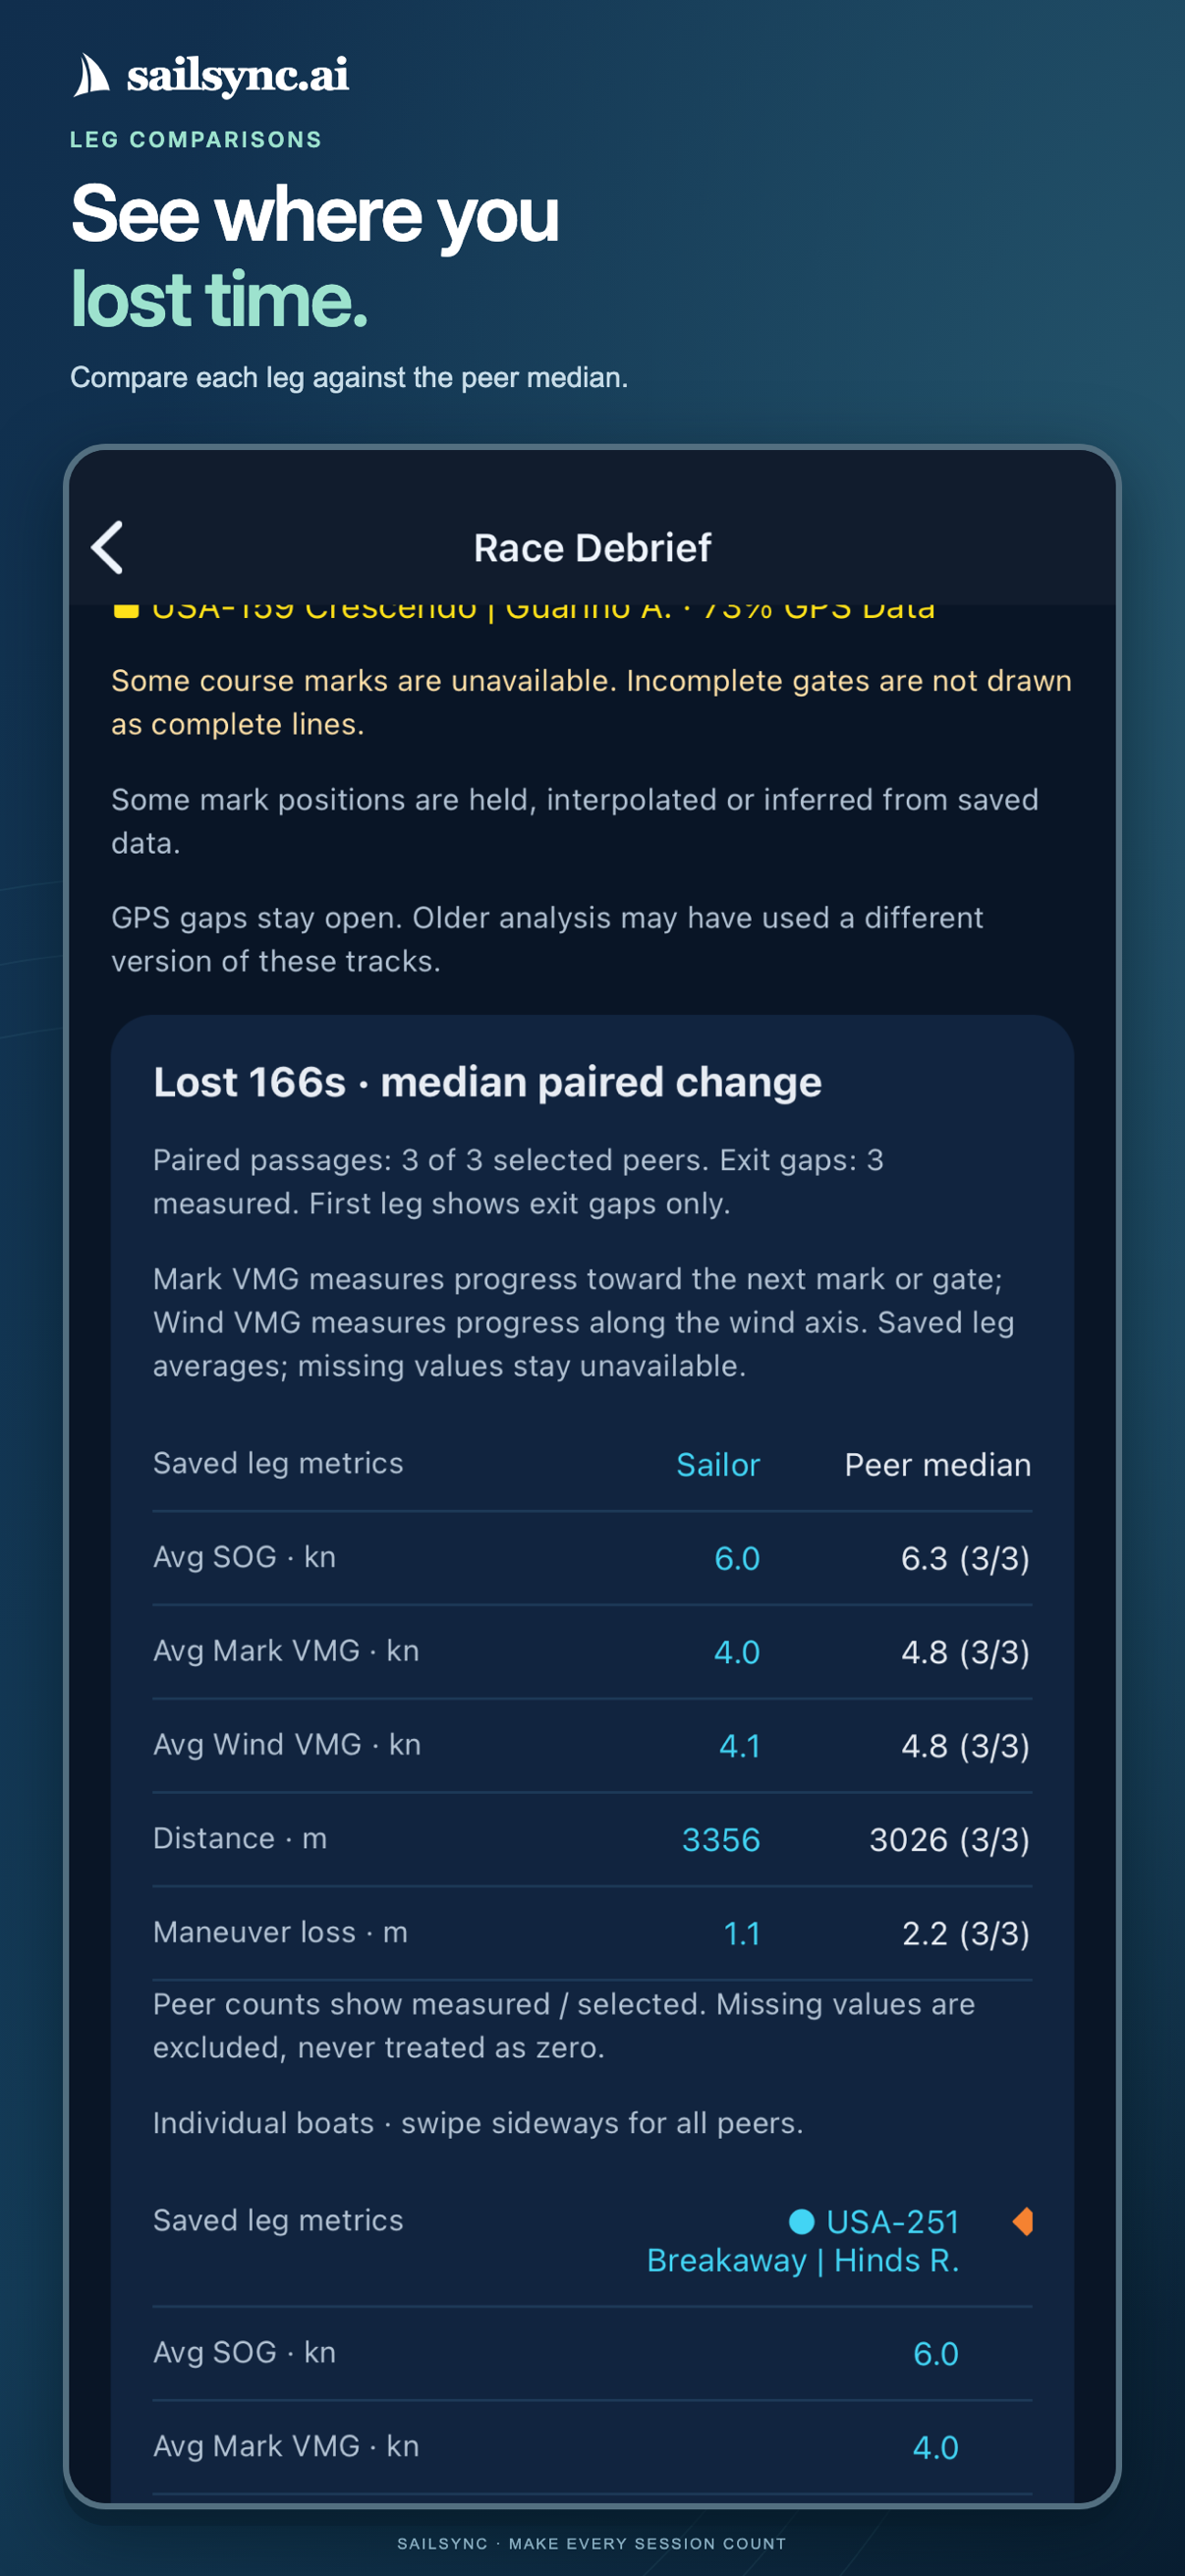
Compare each leg with your peers
Review speed over ground, mark VMG, wind VMG, distance sailed and maneuver loss beside the peer median. Peer counts show which measurements are available; missing values stay unavailable.
In this example, the sailor’s average SOG is 6.0 knots against a peer median of 6.3, while mark VMG is 4.0 against 4.8. Those comparisons help identify what to investigate alongside the routes and conditions.
View full-size leg comparison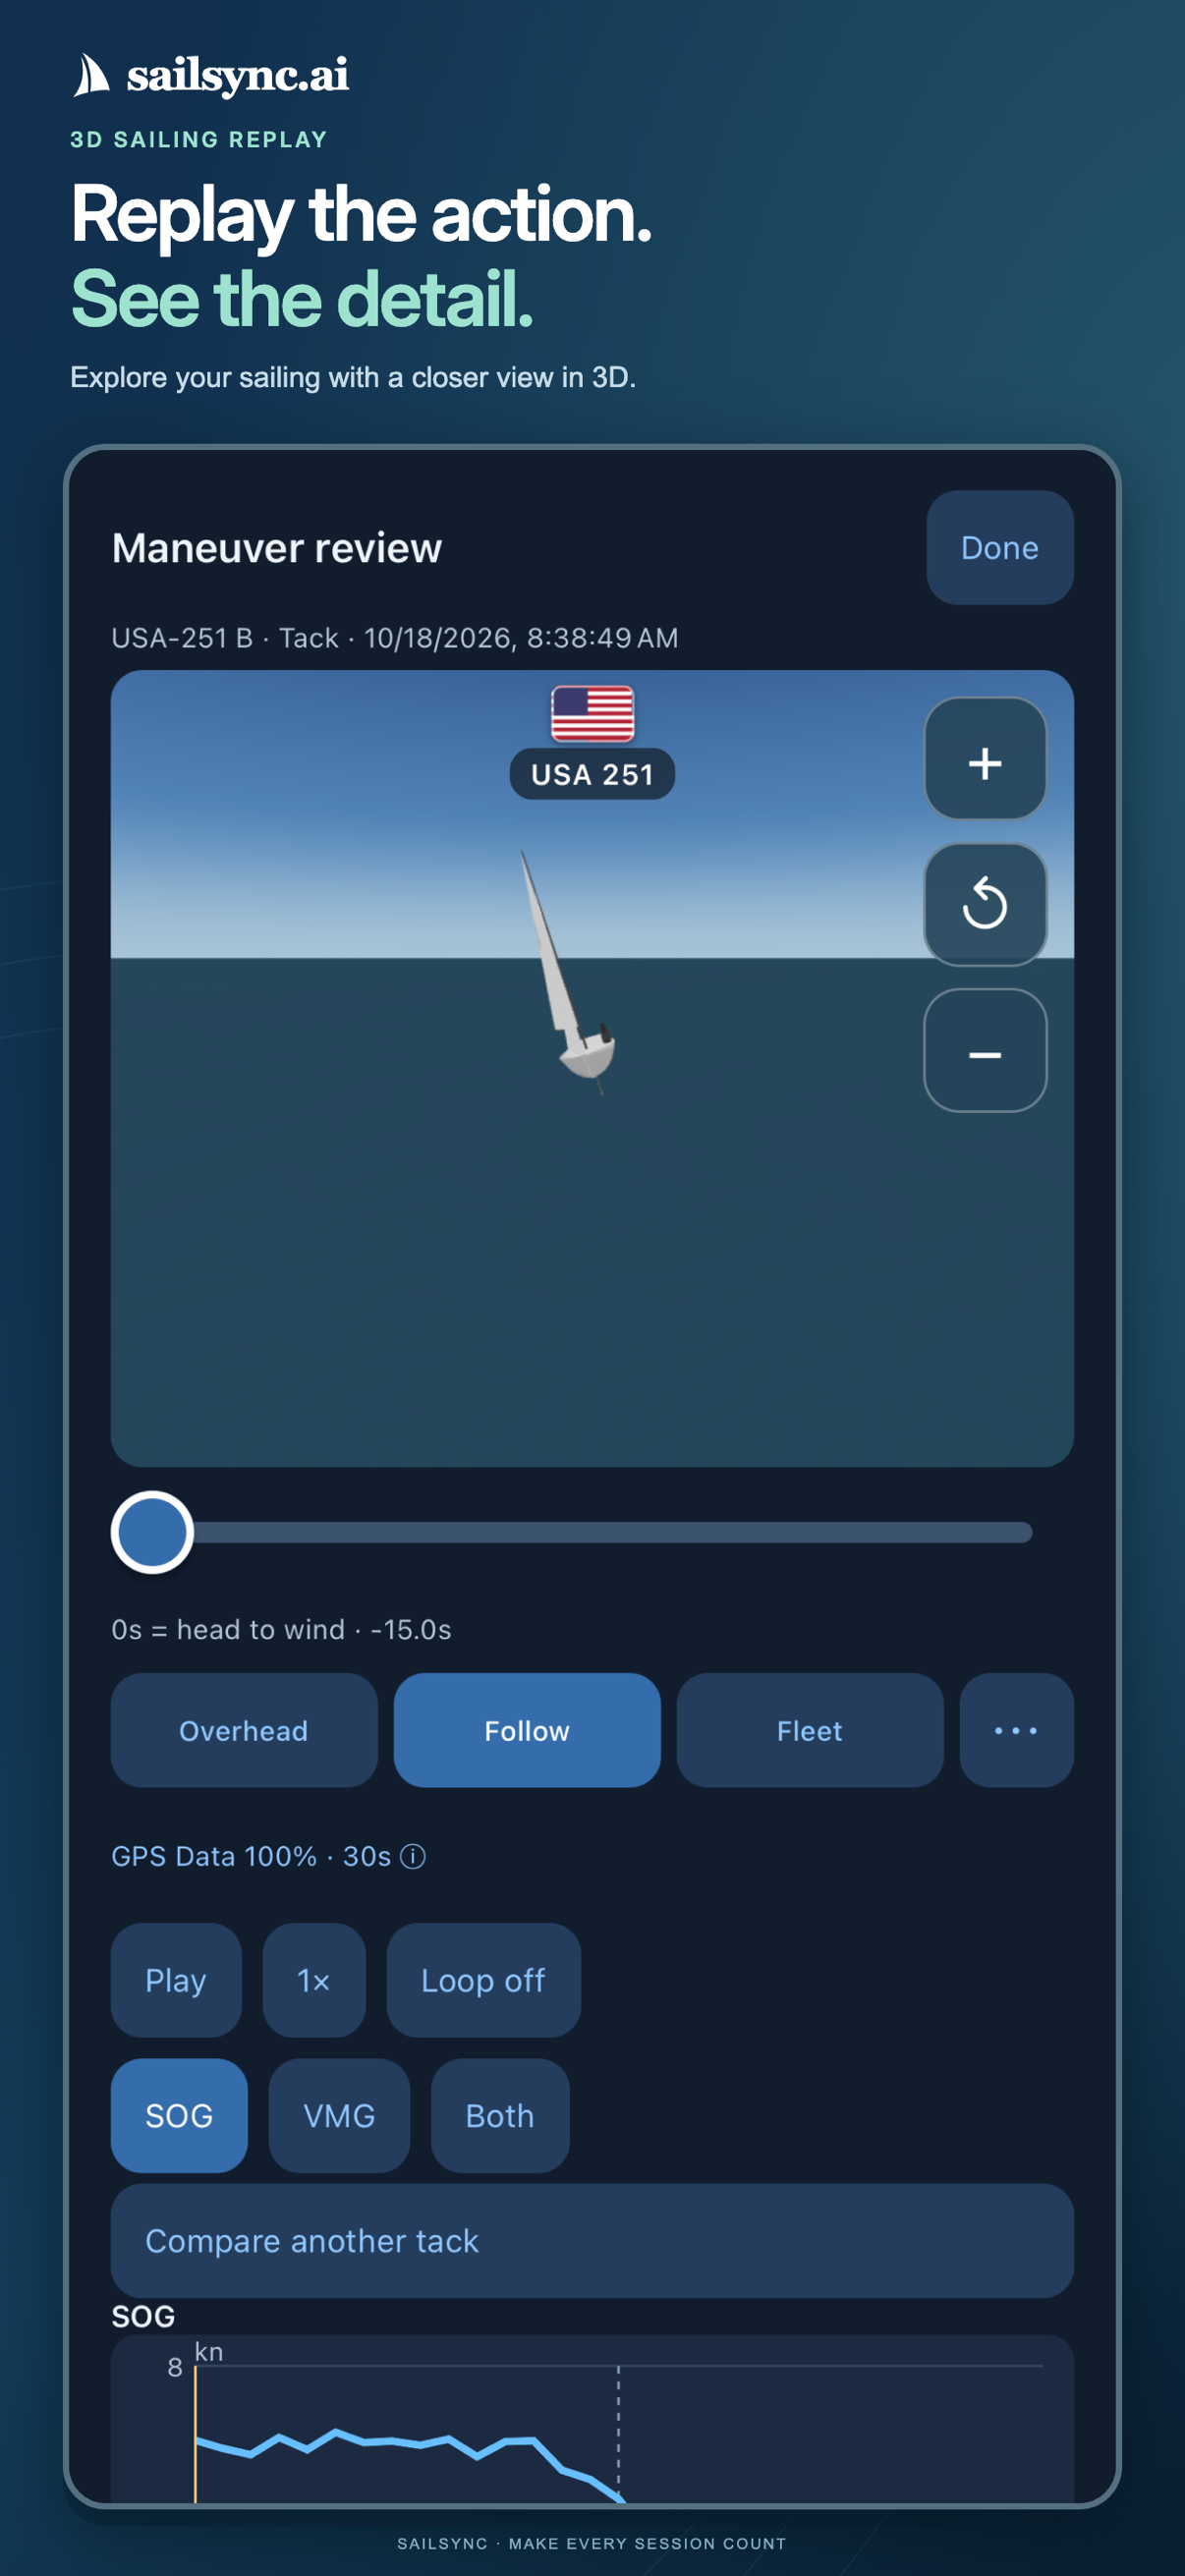
Examine a single tack
Move through the maneuver in 3D, review the speed trace and switch between SOG and VMG. Use the comparison control to review another tack and look for differences in execution.
The maneuver timeline places head-to-wind at zero seconds, giving you a common reference for the turn. The displayed GPS coverage helps you judge the recording behind the replay.
View full-size maneuver reviewAsk FLO, then follow the evidence
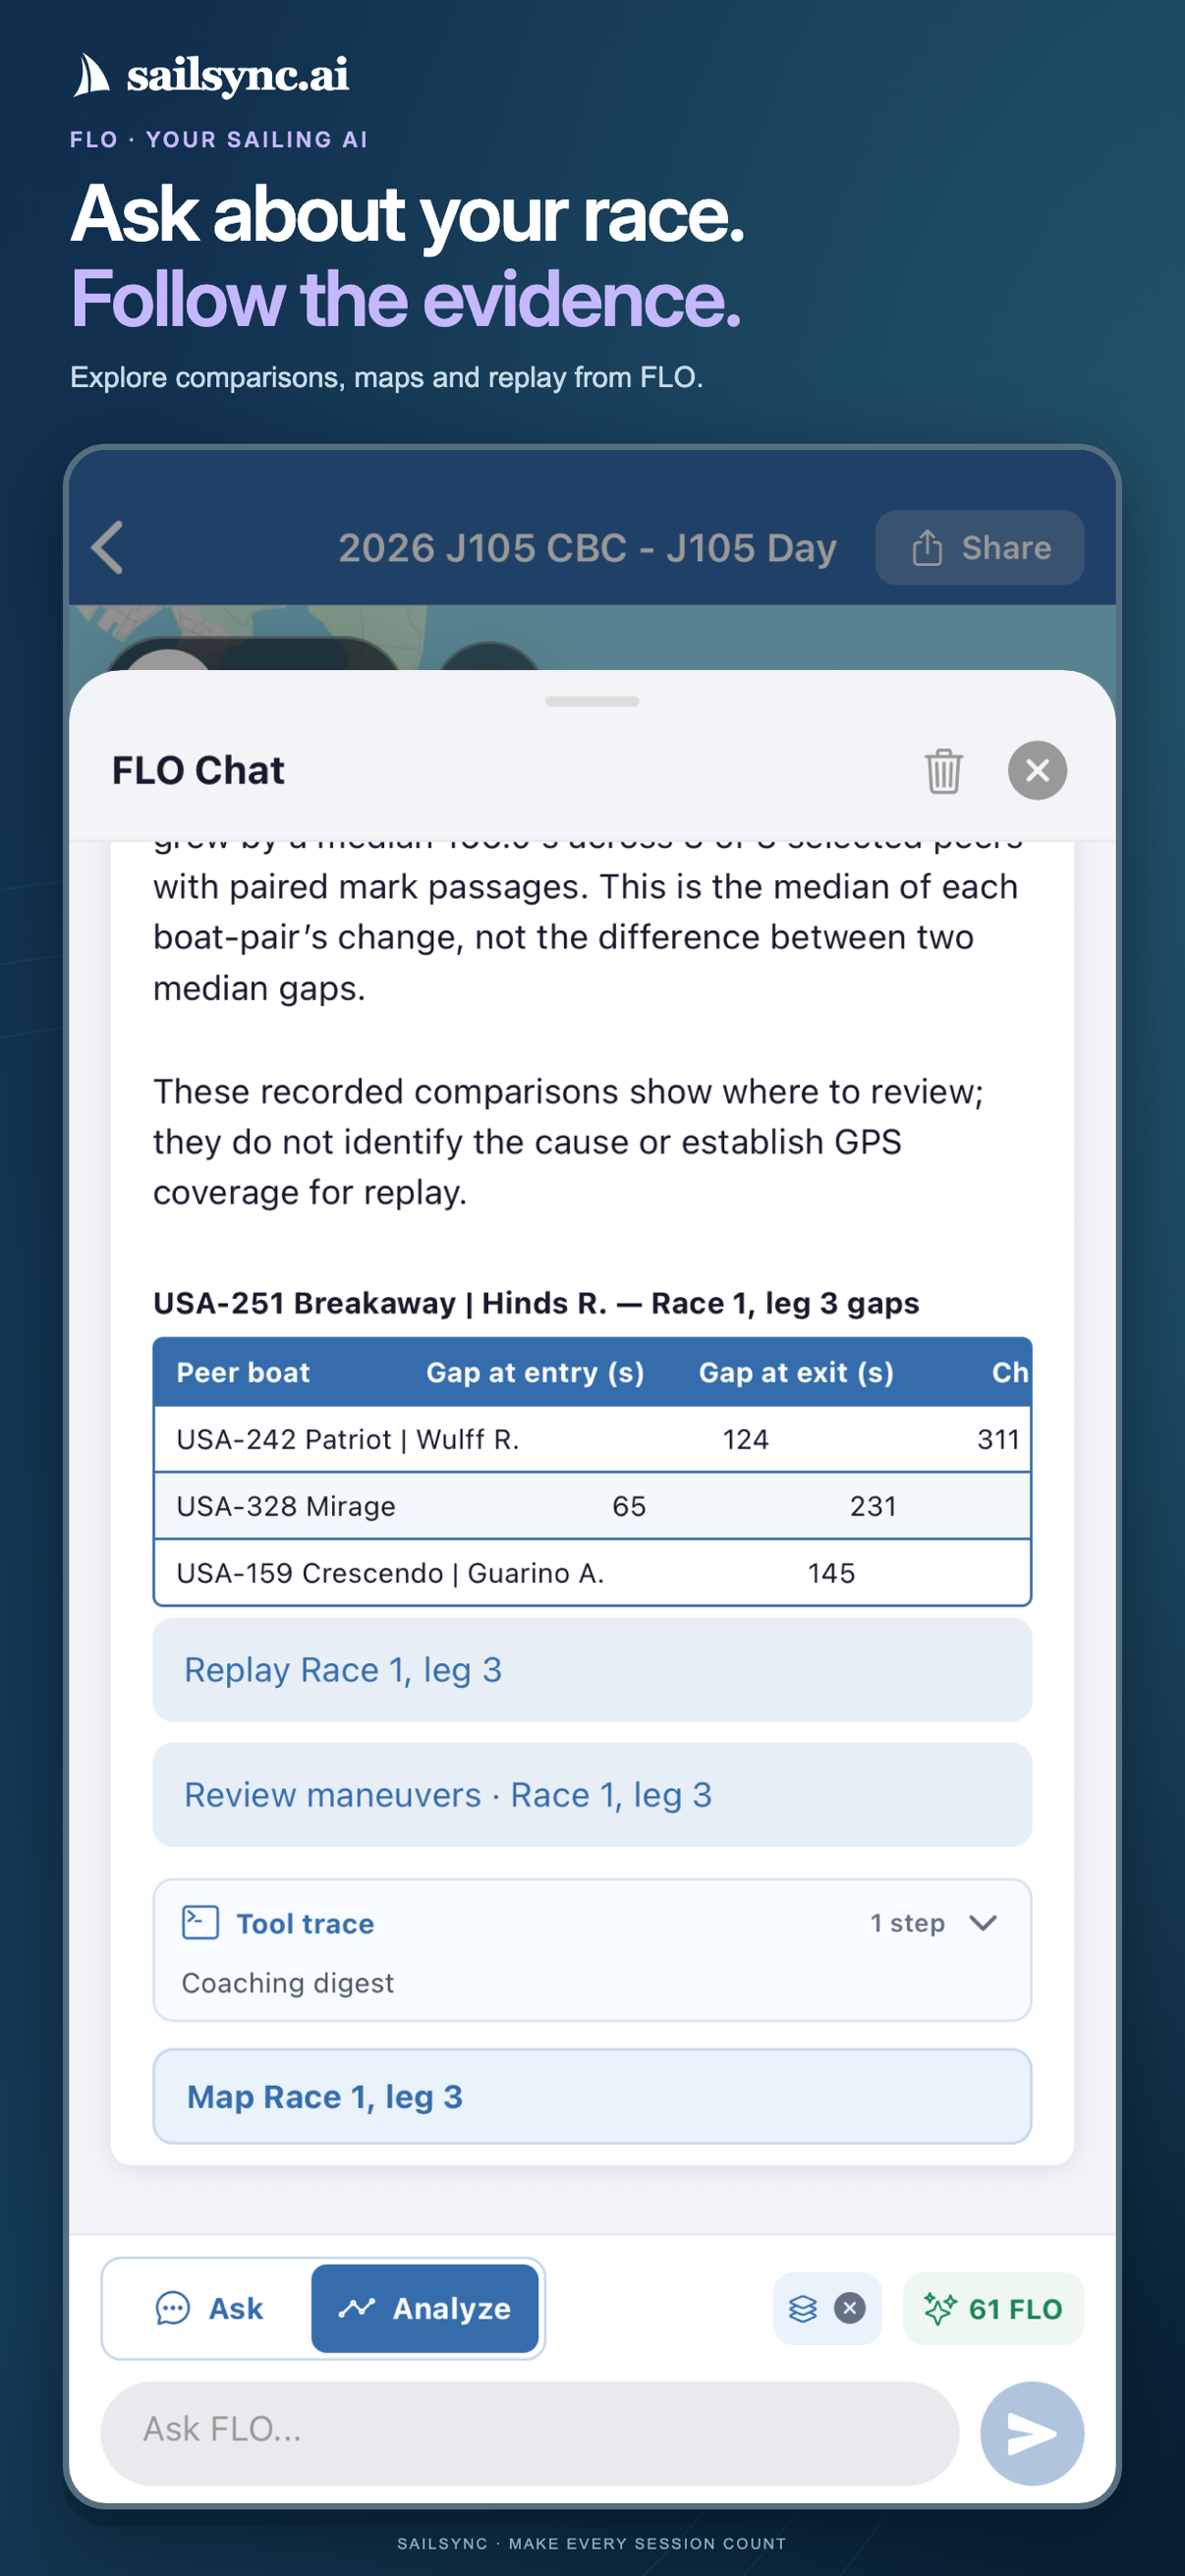
From a measured comparison to the moment worth reviewing
FLO can put a comparison into words and present the supporting table. In this example, entry and exit gaps are shown for individual peers, with actions to replay the leg, review its maneuvers or open the map.
Use the answer to decide where to look, then explore the underlying race. Recorded gaps show how the comparison changed; the routes, conditions and coach’s observations help explain why.
View full-size FLO exampleFrom the start line to the next practice
Start with a question from the race. Use the available statistics and track geometry to test it, then revisit the moment in a replay or report.
| Your question | What to examine |
|---|---|
| Did I give away places at the start? | Line position, distance to the line, speed at the gun, crossing time and the fleet’s positions after the start. |
| Where did the first beat change? | Track separation, course choices, distance to the mark and position changes as the leg develops. |
| Was it boat speed or race execution? | Speed and mark VMG on comparable legs, alongside routes, maneuvers and gaps to other boats. |
| What happened around the marks? | Approaches, rounding order, splits, gaps and tracks before and after the rounding. |
| What should we practice? | Recurring start, speed or maneuver patterns across the available races, reviewed with your coach. |
Available measures depend on tracking quality, configured course and wind, and saved analysis. GPS speed is speed over ground; a speed difference alone does not establish its cause.
See the evidence in a real report
This Race 9 excerpt puts the start-line map beside timing and speed statistics. Read line position together with speed and crossing time, then examine the fleet a minute later to see how the start developed.
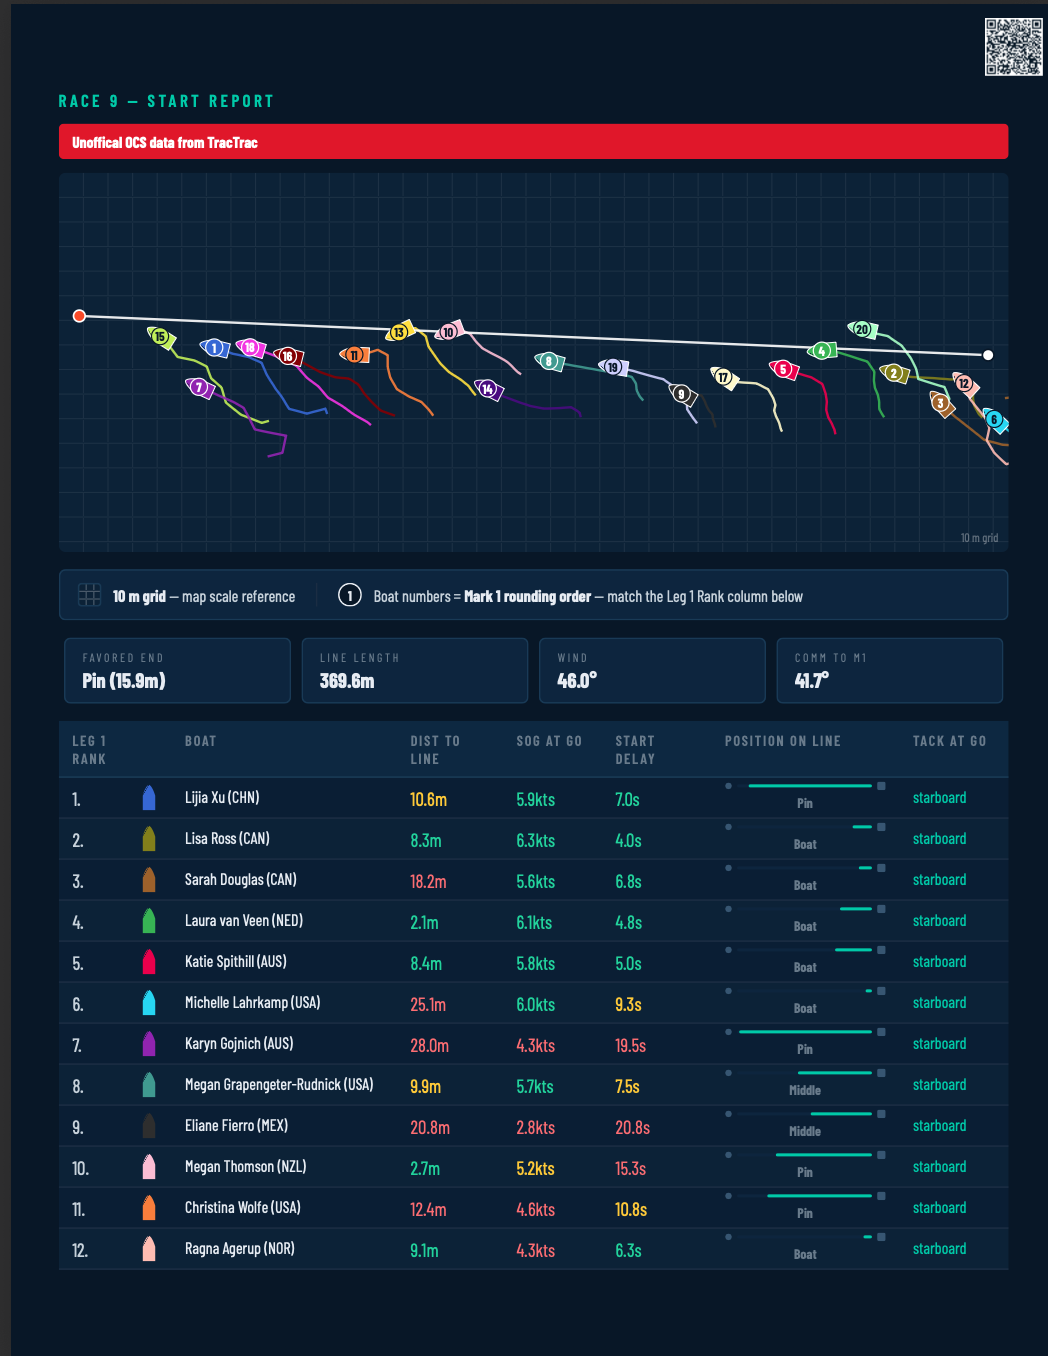
Read a separate complete sample: VX One, Race 1 (PDF). For an interactive walkthrough of start and first-beat excerpts, explore the homepage report examples.
Your training and the wider racing fleet
Record training on your phone or import supported recordings from devices such as Vakaros and Velocitek. For covered regattas, SailSync uses public tracking from TracTrac, MetaSail and Vakaros to make fleet comparisons possible beyond your own uploads.
Standard includes training sessions with up to 10 boats, the 2D/3D player and 2 regatta days every month. Racer includes 5 regatta days per month and Gold includes 20. Check current plans and coverage.
Follow progress across regattas
Add the coach’s perspective: align video and audio with the session, review transcripts and bring commentary into a FLO debrief.
A connected AI agent can gather permitted sessions, compare saved race analysis and calculate trends from GPS records. Use it to prepare a competitor brief, compare training speed or draft priorities for the next training block.
Explore team progress and competitive analysis workflows, or learn how to connect your AI assistant.
Race analysis questions
Can SailSync help explain where a race was won or lost?
Yes. Review start statistics, position changes, leg comparisons and GPS tracks to locate gains and losses. Reports and replays provide evidence for the debrief; explaining a tactical decision still requires the conditions and the coach’s context.
Can I analyze races without recording my own track?
For supported publicly tracked regattas, SailSync can provide event sessions, reports and replays using your account’s event access. Coverage and available analysis vary by event. You can also bring your own supported recordings for training review.
Can I compare performance across multiple regattas?
Yes. SailSync’s Trends tool is available to help you follow performance over time. For custom cross-regatta comparisons, you can also connect an AI agent through SailSync’s MCP/API using the sessions your account can access. The agent combines records and calculates comparisons around your coaching questions. Season-long reports are also coming soon.
Start with your next debrief.
Explore a tracked regatta, bring your own recordings, or talk to us about your team’s workflow.